How do we know the sea ice retreat in the past few years is unusual?
The blog started off by looking at this question, firstly by using satellite data. Since satellite data began in 1979, sea ice extent and thickness have been decreasing at an alarming rate. Sea-ice extent during the summer of 2011 (sept) was almost on par with the previous record low during 2007, even without the unusual weather patterns thought responsible for the 2007 low. This strongly suggests that even though sea ice doesn't decrease every winter, overall conditions are worsening for continued survival of permanent sea ice.
A number of proxy records show a sea-ice history going further back than any contemporary records. As part of the blog, I looked at two relatively new methods of constructing these histories; the IP25 biomarker and Quartz records. These, as well as other methods, including documentary and ice-diatom records, show that extent of sea ice has been strongly variable, but also strongly correlated with climate. Sea ice extent is therefore extremely sensitive to temperature changes, meaning if we were experiencing global warming today, we could expect a significant loss of sea ice. Is that what we've been seeing?
Well, the sea-ice is disappearing at a faster rate than any model used by the IPCC has forecast, even the pessimistic 'business as usual' scenarios shown on the graph below. The graph doesn't show the past 5 years, but if it did the trend would be continuing, with 2007 being the minimum.
 |
| Sea ice extent output values from 13 IPCC Global climate models with an ensemble mean in thick black. Actual observations are shown as a thick red line. Direct from Stroeve et al 2007. |
Of course, this means a few things could be happening. Firstly, there could be some unknown natural variability that
we don't know about. More worryingly though, the extra 'non-predicted' part of warming could be the result of unknown (or badly modelled) response of natural systems to GHG increases or the fingerprint of positive feedback systems. If the latter is correct, most predictions of future climate change could be way out, simply because some possible feedback mechanisms may not have been factored in.
So to conclude, the sea ice patterns registered in the past c.50 years seem pretty unusual. However, it is possible that all we're seeing are the fingerprints of natural variability accentuated by a very sensitive ecosystem. Caution would advise otherwise, and the very high likelihood that this extreme melt is one of the first signs of human-induced climate warming is definitely a disturbing prospect.
In addition to the questions posted at the outset, I think it's a good idea to also ask:
How to we know that other signals of climate change in the Arctic are unusual?
The second post on the blog summarised a few palaeo-proxies from which it's possible to reconstruct aspects of the past environment in which these proxies were deposited or fossilised. I then looked at a couple of papers which used multiple proxies to reconstruct aspects of the Arctic environment during the past 2000 years (Kaufman et al 2009) and through the whole of the Holocene (Kaufman et al 2004).
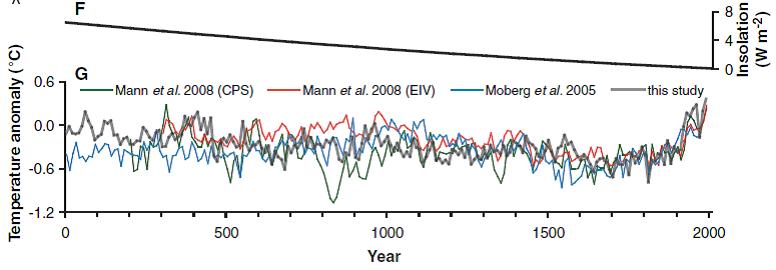
What these showed were a variable climate during the Holocene, but that the recent patterns were unusual in both the magnitude and spatial extent. Significant agreement between different research teams was another important conclusion from these papers. For example, the graph below, direct from Kaufman et al (2009), shows unusual rate of warming during the past 100 years as well as almost remarkable agreement between authors, boosting the plausibility of these findings. Kaufman et al (2009) also show that this warming is concurrent with reducing levels of solar insolation received at the atmosphere, reducing the likelihood of a 'natural' explanation.

Are any changes apparent in terrestrial and aquatic arctic ecosystems?
Let's start with aquatic ecosystems. A number of diatom studies have highlighted significant changes in algae community structure in the past c.150 years. Such changes to the bottom of the trophic levels has the potential to alter the whole ecosystem structure from the bottom up. There have been, in general, large increases in the relative abundance of epipytic diatoms, especially those specialised in growing on mosses, populations of which have grown due to longer ice-free periods and larger 'moats' on Arctic lakes. As well as this, the longer growing season is the likely cause for increased diatom diversity. Climate change as a major cause of these shifts is an attractive hypothesis as it directly influences ice extent and duration on lakes, changes which have likely caused these observed diatom changes. Also, other possible explanations began too early, like increased UV levels, or too late in the case of significant pollution levels to be the main driver. A large study incorporating 55 lakes from around the Arctic exhibited response patterns which, in general, back up the findings of earlier studies.
we don't know about. More worryingly though, the extra 'non-predicted' part of warming could be the result of unknown (or badly modelled) response of natural systems to GHG increases or the fingerprint of positive feedback systems. If the latter is correct, most predictions of future climate change could be way out, simply because some possible feedback mechanisms may not have been factored in.
So to conclude, the sea ice patterns registered in the past c.50 years seem pretty unusual. However, it is possible that all we're seeing are the fingerprints of natural variability accentuated by a very sensitive ecosystem. Caution would advise otherwise, and the very high likelihood that this extreme melt is one of the first signs of human-induced climate warming is definitely a disturbing prospect.
In addition to the questions posted at the outset, I think it's a good idea to also ask:
How to we know that other signals of climate change in the Arctic are unusual?
The second post on the blog summarised a few palaeo-proxies from which it's possible to reconstruct aspects of the past environment in which these proxies were deposited or fossilised. I then looked at a couple of papers which used multiple proxies to reconstruct aspects of the Arctic environment during the past 2000 years (Kaufman et al 2009) and through the whole of the Holocene (Kaufman et al 2004).
What these showed were a variable climate during the Holocene, but that the recent patterns were unusual in both the magnitude and spatial extent. Significant agreement between different research teams was another important conclusion from these papers. For example, the graph below, direct from Kaufman et al (2009), shows unusual rate of warming during the past 100 years as well as almost remarkable agreement between authors, boosting the plausibility of these findings. Kaufman et al (2009) also show that this warming is concurrent with reducing levels of solar insolation received at the atmosphere, reducing the likelihood of a 'natural' explanation.
Are any changes apparent in terrestrial and aquatic arctic ecosystems?
Let's start with aquatic ecosystems. A number of diatom studies have highlighted significant changes in algae community structure in the past c.150 years. Such changes to the bottom of the trophic levels has the potential to alter the whole ecosystem structure from the bottom up. There have been, in general, large increases in the relative abundance of epipytic diatoms, especially those specialised in growing on mosses, populations of which have grown due to longer ice-free periods and larger 'moats' on Arctic lakes. As well as this, the longer growing season is the likely cause for increased diatom diversity. Climate change as a major cause of these shifts is an attractive hypothesis as it directly influences ice extent and duration on lakes, changes which have likely caused these observed diatom changes. Also, other possible explanations began too early, like increased UV levels, or too late in the case of significant pollution levels to be the main driver. A large study incorporating 55 lakes from around the Arctic exhibited response patterns which, in general, back up the findings of earlier studies.
 |
| Significant and sudden rise in the periphtic diatom species Pinnularia balfouriana found in Elison Lake by Douglas et al (1994) |
Large changes were also apparent from studies of chironomidae from lake sediments. Absolute numbers, especially numbers of species adapted to 'scraping' and consuming peripytic algae species were found to have increased since c.1850, strongly suggesting the impact of moss growth patterns on higher trophic levels. As these chironomid larvae eventually become midges, these shifts in aquatic ecosystems also have the potential to influence terrestrial ecosystem structure.
On land changes were apparent, but muted because of extremely long response times, especially of the tree line. Small changes have been seen in shrub cover, shown by photographic comparison, but no real conclusive findings have resulted from studies of modern changes to the tree line. This is understandable though, as trees take a long time to grow and significant warming has only been happening for less than 100 years. It's clear then that any changes caused by Climate change will be seen first in aquatic ecosystems as well as in most organisms with a short life span, and any changes to long-lived vegetation will likely only be seen in the long-term.
Permafrost is another feature of the Arctic which is also changing, causing collapsing trees and houses, and encouraging decomposition of stored organic material (causing the bubbles of methane seen in the lake ice). Widespread decomposition of previously stored up carbon is a worrying prospect, which appeared to be happening during the 1980s, when it was calculated that the northern tundra had become a source of carbon, rather than a sink. Recent studies, though, have shown that the sudden pulse of carbon has now reduced and in some places returned to normal levels, perhaps due to increased uptake by vegetation and shifts towards more productive plants. Therefore it seems that the pattern of melting ice causing the mobilisation of all the carbon is simplistic, as the environment seems capable of pretty quick adaption. Other negative feedbacks exist including insulating moss growth, which possibly protects shallow layers of permafrost from the severest warming.
Is anything else apart from rising temperatures causing change?
I considered both increased UV radiation from possible ozone depletion in the Arctic and pollution as possibilities. Ozone levels in March 2011 were at a record low, and were described by some as a 'hole' similar to that over the Antarctic. Conditions leading up to the 2011 low, however, were likely due to unusually cold conditions caused by an Stratospheric polar vortex system, leading to increased Polar Stratospheric Cloud formation. Although it's true that the ozone levels followed a similar seasonality to the Antarctic, levels on average were still much higher than the Antarctic, and the areas affected were much smaller. Continually falling temperatures in the stratosphere though, another possible impact of climate change, could mean these events become more common. One to watch, then.
Pollution is transported to the Arctic via the atmosphere, rivers and the ocean, meaning that raised pollution levels have been found across the Arctic. Although many POPs have been banned in the last few decades, there is potential that sea ice melt could be causing re-mobilization of some previously stored pollutants, causing a small increase in detected atmospheric concentrations of some POPs. Suprisingly, there are some significant local sources of pollution found within the high Arctic, as shown by the example of the coal-fired power stations on Svalbard. As well as that, there is potential that human activity many centuries ago was also causing raised levels of pollution. Possible impacts of pollution upon the Arctic ecosystems are difficult to detect though, as levels are still fairly low, especially when compared to other regions. However, this doesn't mean that there is no impact, and this coupled with the fact that 'new' and potentially more dangerous POPs are increasing in concentration mean that legislation and continued monitoring is still required.
Next time, the rest of the questions...
No comments:
Post a Comment