As mentioned at the end of the last post, palaeo-records are not perfect, and the way to ensure the best picture is to compare multiple proxies in aptly-named multi-proxy studies. A recent such synthesis study focussing on average temperature changes in the arctic is Kaufman et al (2009) ‘Recent Warming Reverses Long-Term Arctic Cooling’. A discussion of this and related articles will hopefully go some way towards answering the question of how we know recent warming is unusual.
The authors of this study combined the results of 23 palaeo-records with at least a decadal resolution from the arctic region. Seven ice core, 4 tree-ring and 12 lake records were included, with the lake records incorporating sedimental and biological indicators*. These data were taken from various individual studies, allowing a synthesis reconstruction of past temperatures extending 2Kyr BP. A strong cooling trend was found until around AD1950, likely caused by decreasing solar insolation (here a product of precessional cycles, see past the jump), and assertion backed up by a Community Climate System Model run in the same study.
What’s clear post-1950, however, despite the continuous insolation trend, is an upward spike in most of the proxies. Tree-ring records exhibit the most sudden and significant response, with lake records showing a large but more gradual trend, likely the result of the differences in annual resolution between the two proxies:
 |
| '2000' relates to AD2000, therefore warming taken place in past 100yrs. |
The ice core data, however, is more perplexing, and under initial investigation suggests a further cooling trend. Strangely, this feature is not commented upon by the authors in the published paper, although the nature of the journal may have limited the extent to which the results could be fully discussed. Despite this, combined results (in grey above) show an increase from a -0.5 to +0.2 (standardised to 900-1800yr period) temperature anomaly during the period 0 to AD1950, which increases further to +1.4 for the very latest records. The recent warming trend agrees with the global climate review articles shown below by Mann et al (2008) and Moberg et al (2005). The global reconstructions, however, show greater variability during the '1900 year cooling period', suggesting that the cooling trend appears to be confined to the Arctic caused by the dominance of solar forcing upon the regional climate.
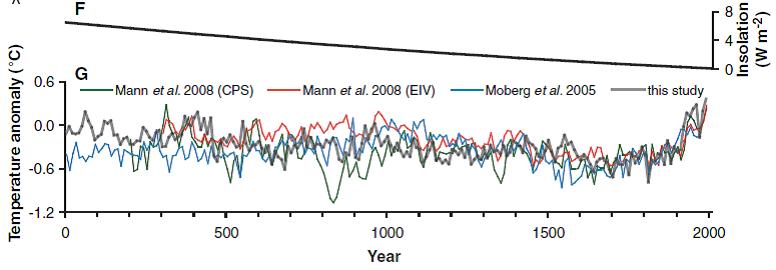 |
| (F) decreasing solar insolation recieved at the atmosphere in the arctic region caused by precession (G) synthesised reconstruction from this study shown in grey compared to global synthesis reconstructions. |
In light of the past 2Kyr then, the recent warming trend in the Arcticis sudden at around 1950, and reverses the cooling trend of the past 2Kyr despite continued precessional forcing. It is clear from this study that the recent warming is unusual and has been clearly registered on a number of proxy records around the arctic. The extent of this synthesis is only 2Kyr, however. In the next post I'll look at a few papers to get an idea of the Arctic climate throughout the Holocene.
*For an explanation of these methods and links to literature, look at this previous post.
A diagram explaining solar forcing factors, including precessional cycles as mentioned above:

Eccentricity cycles last for approx. 100,000 years, Obliquity (or tilt) for 41,000 years and Precession for 25 and 19,000 years.
Could the 'cooling trend' in the ice data not just be part of natural variability? You should have a look at the following paper, which many be of interest. Although I am sure there are more up to date meta studies now published.
ReplyDeleteMagnuson, J.J., D.M. Robertson, B.J. Benson, R.H. Wynne, D.M Livingstone, T. Arai, R.A. Assel, R.G. Barry, V. Card, E. Kuusisto, N.G. Granin, T.D. Prowse, K.M. Stewart & V.S. Vuglinski, 2000: Historical trends in lake and river ice cover in the northern hemisphere. Science, 289, 1743-1747
Correction: The ice core data are calculated from δ18O ratios and taken from sites in Greenland and Northern Canada. The tree-ring data are made up of ring width measurements assumed to be indicative of temperatures during the warm-season.
ReplyDeleteThanks for the reference, I think some more reading is required as to the processes and nature of the data! I'll look into it and blog soon