Saturday 31 December 2011

Recent warming of Arctic Water (AW)

Just a short post about a short article from Science which was published in January. Spielhagen et al (2011) counted assemblages of planktonic foraminifera from a 14C dated core taken from the West Coast of Svalbard, with a resolution of around 18 years, higher than previous works. In total the core was found to cover c.2000 years. Planktic foraminifers typically grow between 50-150m ocean depth and the 'bloom peak' is around August meaning these records are of summer ocean temperature. Estimates of temperature were calculated by a statistical comparison of assemblages found in the core to a modern dataset of foraminifera assemblages from areas with different environmental conditions. It's hoped that by using this Modern Analogue Technique (MAT), it's possible to match up two similar assemblages, and it's assumed that conditions which determine the two aren't going to be that much different. Clearly, the assumptions, and therefore possibility for error are pretty big, so results have to be pretty significant to be meaningful.

The results showed a large increase in temperature in the past c.150 years, which was unusual when compared to the past 2000 years, found to be similar to the observational records of the Arctic Atlantic Warm Layer (AAWL). This strongly suggests that Arctic Water (AW) inflow from the Atlantic is warming, which has the potential to significantly speed up sea ice melt.

Of course, this is based on only one core, so this article is more of a call for more research rather than necessarily conclusive findings. It will be interesting to see if the significance of these AW changes can be de-tangled from all the other influences of Arctic sea-ice levels.

Friday 30 December 2011

SCPs in the Arctic (Arctic Pollution Part II)

Continuing from the last post on Arctic pollution, this post will look at the pollution record from Svalbard, a remote island off the coast of Norway high into the Arctic circle.


Due to it's remoteness, it's a great place to look for traces of long-range pollution transported from industry and agriculture in the Northern Hemisphere, especially from Russia. Many studies have found evidence of such long range contamination which gets to the Arctic via the atmosphere, rivers and oceans.

A more systematic study was carried out by a number of academics in the 1990s using lake sediments which, as we've learned, give a record of pollution far longer than atmospheric measurements can. For example, it's possible to estimate pre-industrial levels of pollution using this method. One paper from this study by Rose et al. (2004) was especially interesting and showed significant local sources of pollution, something I found surprising for such a

Tuesday 27 December 2011

POPsicles in the Arctic? (Arctic Pollution Part I)

We've already considered one thing (other than climate change) which has the potential to affect the Arctic environment, increasing UV from an 'ozone hole'. Another one of these potential 'things' is pollution, or more scientifically, chemicals and compounds where they're not supposed to be naturally. One things humans have always done is burn things, and the record of these activities is clear in the palaeo-archives, from the prehistoric burning of small wood fires, through large scale burning for clearing right to the modern widescale burning of almost anything and everything seen since the industrial revolution. What is more recent though is the widespread use of pesticides and the growth of heavy industry. We tend to see the Arctic regions as a wilderness, wild and untouched. However, many types of pollutants have been found across the Arctic circle.

In this and the next post, I won't attempt to try and fully describe the extent of Arctic pollution. There are just too many pollutants and studies to do that! Rather, I'm going to focus on a couple of papers which have some interesting findings relating to POPs and SCPs (I did warn you about the acronyms).

States signed up to the Stockholm Convention on Persistent Organic Pollutants (green)
Source: http://toxipedia.org/display/toxipedia/Stockholm+Convention   
The Arctic Monitoring and Assessment Programme (AMAP) was set up in 1991 as part of the inter-governmental 'Arctic Council'. It's website it full of reports, both scientific and for the press which are freely available and are

Monday 26 December 2011

An Arctic Ozone 'Hole' - a new threat?

I was looking at the news today and came across a very short article from the Independent, which, despite it's size, had been the sixth 'most-read' Environmental article in the Independent during 2011. I'm not sure whether it's the topic that drew the most readers, or the title: 'GIANT ozone HOLE found above Arctic' (own capitalisation!). Due to this likely exaggeration and the fact that I hadn't heard this apparently popular news story, I decided to have a look at the original paper the article was based on. The paper was published in Nature as is titled 'Unprecidented Arctic Ozone Loss in 2011' by Manney et al 2011.* They reported a record low ozone level of 220-230 Dobson Units (DU) recorded in March 2011, but could you day this was a 'huge hole'? Also, was this anything to do with climate change or this just a random and freak occurrence?

Polar Stratospheric Clouds (PSCs) photographed in Sweden
http://earthobservatory.nasa.gov/IOTD/view.php?id=622
According to the authors, the possibility of significant ozone 'holes' in the Arctic has been debated for decades, with some arguing that higher temperatures in the Arctic than the Antarctic prevented such formations. The basic

Monday 19 December 2011

A short introduction to Arctic pollution...

One of the questions set out at the start of the blog was:

Is anything else apart from rising temperatures causing change?

In the next post I'm going to have a look at one other human impact on the arctic; pollution. The subject is filled with Three Letter Acronyms (TLAs...) so I'll generalise where possible. Here's a really short video which explains how the pollution gets there. Stay tuned for a discussion...

This video and others are freely available from the Arctic Monitoring and Assessment Programme website: http://www.amap.no/

Friday 16 December 2011

Melting Permafrost - should I be worried?

Just before getting started, I found the video I really wanted to share with you guys before, but ended up using a replacement. It's from the fantastic series 'Earth: The Power of the Planet', presented by the brilliant Prof Iain Stewart, a Geologist at the University of Plymouth. He's like Geology's answer to Brian Cox! If you missed the series, I'd encourage you to have a catch-up. Interestingly, this video also features the same Dr Walter as the previous video..


Although it's the easiest and most spectacular way of showing the processes which are happening, it's not the lakes that are causing the most concern. Phrases like 'ticking time bomb' and 'unstoppable warming' are used

Wednesday 14 December 2011

Treeline in the Arctic

As promised, I'm going to consider the Arctic Treeline for this next post. Just as a warning, one of the papers I use in this post includes some sites from below the 66 degrees latitude level, so I hope you'll forgive the slight digression from our brief.
An alpine treeline in the background. Although not an Arctic treeline,
the clear change illustrates the concept well.
Firstly, what is the Arctic treeline? As an intuitive general definition, a treeline separates regions where tree-growth is sustainable, and areas where climatic factors such as low temperatures prohibit the establishment

Sunday 11 December 2011

Exploding Ice

So far we've mostly looked at shifts in diatom and chironomid assemblages in the Arctic. Although interesting (I hope), it all might be a bit abstract and... small. So the next few posts are going to focus on changes in the arctic that are slightly more tangible. Firstly I'm going to discuss the treeline; what it is, how it has changed in the past and how it's been changing recently. Then, in the next post, I'll look at a change that is causing concern; the tundra shifting from being a sink of GHGs to a source through the melting of permafrost.

Before that though, here's a great video from the University of Alaska showing the build up of methane in frozen lakes during the winter, with some explosive results!

Thursday 8 December 2011

On thin ice? (another 'light' post)

I've just finished watching the final part of BBC's 'Frozen Planet' series called 'On Thin Ice', which was written and presented by David Attenborough. It's noteworthy for a few reasons. Firstly, the Discovery Channel in the USA only just decided to show this final episode, previously declining to show it to the American audience, likely fearing a backlash from Climate Change Skeptics. Reasons for the initial rejection are unclear, ranging from the patronising but innocent ie. "Who's David Attenborough?" (the series is being narrated by Alec Baldwin on Discovery) to the concerning; it's impact on the upcoming US elections. Of course, climate change campaigners had reacted to the announcement with anger.

This is a QR Code. Scan it with your smartphone to follow the link 
A more interesting response to it, in my view, and the one which has caused the bigger reaction from the makers of the program and the academics involved is..

Friday 2 December 2011

Shrubland expansion - photographic evidence

To start off the posts on terrestrial ecosystem change, I'd like to share a short (one page!) correspondance article from Nature by Sturm et al (2001). It's pretty simple and is completely qualitative based on only two 'observations', but it's interesting nonetheless. The authors found high quality photographs, taken during oil reserves exploration in 1949 at around 68° latitude in the Alaskan Arctic. By taking 66 modern photographs at some of the same locations, they could compare the vegetation cover at the same sites over the 50 year period. Here's one of the comparisons:

A hillside in the Alaskan Arctic in 1949 and 2000. A and B show identical locations.
Although a crude assessment, it is clear that there is a difference between the two photographs. Abundance

Monday 28 November 2011

Update on Recent Ice Extent

I started the blog off talking about the record low sea-ice extents seen in the Arctic in recent decades, showing a graph of this years data against 'record low' years. It was clear that 2011 experienced the second lowest ice extent in the satellite record, just beaten by the record-breaking 2007 year with it's unusual weather patterns. As discussed, 2011 did not experience 'unusual' weather as in 2007 around the Arctic, making the almost record concerning. I know you haven't been able to sleep since because of it, so I thought I'd give an update as has been recently published.
http://nsidc.org/images/arcticseaicenews/20111102_Figure2.png
The good news is that the ice extent rapidly increased during the end of October, meaning it hasn't yet been lower than 2007. Despite this, it's still far lower than the 1979-2000 average, including 2 standard deviations. 'Record low' years for each decade are also shown, 1984 and 1999, which were lower than the average but nothing compared to the last few years. Just to illustrate the difference, the UK has an area of 243,610 Km squared, meaning the difference between 2011 and 1999 ice extent at the end of October is about 5-6 times the size of the UK. It's also about the same size as 1 Mongolia, 75 Wales(s), 9,375 Liechtensteins and 3,000,000 Vatican Citys (don't say I don't help you out).

To keep up to date and save you those sleepless nights you can keep checking for updates on sea-ice extent here.

Monday 21 November 2011

Arctic Lakes and Zoological Indicators

As we saw in the last post, it is highly likely that climate is indirectly altering Diatom communities in high Arctic lakes through changing levels and patterns of ice cover. Quinlan et al. (2005) used the same cores as the (previously reviewed) Douglas et al. (1994) study and counted the fossil chironomid (non-biting midge) larvae remains down the cores to investigate whether invertebrate communities have also 'shifted', and if they have, how likely it is that the changes are linked to the results from the previous diatom investigations. It's important to note, however, that these results are only taken from three archives (ie lakes and ponds) from Ellesmere island so further study is required to confirm that these findings are widespread.

Chironomidae are a family of flies which are aquatic organisms until their adult stages (see above) and

Sunday 20 November 2011

Arctic Lakes and Diatom Change - A Brief Summary

As promised, I'm going to cover the Smol et al (2005) article this time, as well as some associated references which will form part of the discussion. This post will focus on the Diatom changes seen in a wide range of Arctic lakes and their inferred causation. It's generally accepted that the Arctic regions will experience the effects of climate change disproportionately to other regions. This, coupled with the sensitivity of Arctic lakes, (potentially) makes this form of study an early indicator of the speed and severity of climate change in the future on a global scale. (Oops, I may have partly answered the final question). Oh well, on with the post...

A subarctic lake from Northern Quebec
Arctic Lake ecology is nice summarised by Smol and Douglas (2007) and shows that

Friday 18 November 2011

Thresholds and tipping points? - Arctic lake 'regime shifts'

For the next post I'm going to be reviewing an article by Smol et al (2005) entitled "Climate-driven regime shifts in the biological communities of Arctic lakes". So before I launch into that, I thought it would be best to have a review of the ecological theory surrounding what they are calling 'regime shifts' by looking at the article they reference. Ecological shifts can occur naturally (such as through fires) or, as is more likely in recent times, due to human activities. Click 'Read more' for a proper explanation...
Conceptual diagram of regime shifts and alternative
stable states. Direct from Scheffer et al (2001)

Monday 14 November 2011

Using Quartz as an Ice Rafted Debris (IRD) record

In addition to IP25, Axford et al 2011 (as mentioned in the previous post) also tested the presence of Quartz in marine cores as a proxy for ice rafting in the North Atlantic. Both of these proxies allow a reconstruction of ice abundance in the Northern Atlantic regions. Unlike IP25, however, Quartz is not a biological proxy, rather it is sometimes present as a 'foreign' material assumed to have been transported by floating ice (icebergs). Click 'Read more...' for a short summary of the method and a couple of examples.


Thursday 10 November 2011

Frozen Planet Extras

Here's a great site, part of the Open University extras for the Frozen Planet series on BBC narrated by Daivd Attenborough. It's a really interesting Google Earth 'mashup' including current weather and ice maps, and a timeline of Arctic exploration. I particularly liked the interactive 'current weather' map which shows the latest meteorological data from loads of weather stations in the Arctic regions. Can't see much use for it, but it's definitely interesting!


Also, thanks to Laura for linking to this, get a free poster. It's mostly of the Antarctic on the sign-up page but I'm assuming (and hoping!) it will have the Arctic on the back!

Wednesday 9 November 2011

The C25 HBI Monoene AKA "IP25" biomarker in marine sediment cores - a valuable contribution?

I know at the end of the last post I promised a move away from palaeoclimate studies to ecosystem change, but there's a couple of subjects I've recently come across that I thought would be interesting to consider before moving on (sorry!). The first one is the use of IP25 from Marine sediment cores to reconstruct a history of ice extent in the Arctic region.
Skeletal formula of the IP25 biomarker

Sunday 6 November 2011

Kaufman et al 2004

Catchy title huh? I've just finished reading a really impressive and interesting article by Kaufman et al (2004) called "Holocene thermal maximum in the western Arctic (0–180 W)". The (many) authors included Holocene records from 140 sites, incorporating ice core, peat bog, marine and lake records distributed around the Western Arctic and considered in four major regions shown below. Unlike many of the palaeo-studies available in this region and in general, the authors sought to investigate the spatial distribution and timing of the 'Holocene Thermal Maximum' (HTM), a period in the early-to-mid Holocene in which averaged Northern Hemisphere temperatures peaked. Just as with the paper we considered in the last 'scientific' post, the authors used multiple proxies, all with varying reaction times and resolutions, giving them a fuller picture. By taking this approach they found some interesting and important results. Follow the jump for a summary...

Monday 31 October 2011

Aurora Borealis


As seen so far in the blog, the sun's activities cause and contribute to noticeable impacts upon the climate in the Arctic, dominated by the Milankovitch cycles of Eccentricity, Tilt and Precession. Solar activity has more visible and short term effects in the Arctic, however, including the 'Aurora Borealis' or the Northern Lights. Click 'Read More' for videos, links and explanations...

Tuesday 25 October 2011

Using the Arctic Proxies (past 2Kyr)

As mentioned at the end of the last post, palaeo-records are not perfect, and the way to ensure the best picture is to compare multiple proxies in aptly-named multi-proxy studies. A recent such synthesis study focussing on average temperature changes in the arctic is Kaufman et al (2009) ‘Recent Warming Reverses Long-Term Arctic Cooling’. A discussion of this and related articles will hopefully go some way towards answering the question of how we know recent warming is unusual.
The authors of this study combined the results of 23 palaeo-records with at least a decadal resolution from the arctic region. Seven ice core, 4 tree-ring and 12 lake records were included, with the lake records incorporating sedimental and biological indicators*. These data were taken from various individual studies, allowing a synthesis reconstruction of past temperatures extending 2Kyr BP. A strong cooling trend was found until around AD1950, likely caused by decreasing solar insolation (here a product of precessional cycles, see past the jump), and assertion backed up by a Community Climate System Model run in the same study.

What’s clear post-1950, however, despite the continuous insolation trend, is an upward spike in most of the proxies. Tree-ring records exhibit the most sudden and significant response, with lake records showing a large but more gradual trend, likely the result of the differences in annual resolution between the two proxies:


'2000' relates to AD2000, therefore warming taken place in past 100yrs.

The ice core data, however, is more perplexing, and under initial investigation suggests a further cooling trend. Strangely, this feature is not commented upon by the authors in the published paper, although the nature of the journal may have limited the extent to which the results could be fully discussed. Despite this, combined results (in grey above) show an increase from a -0.5 to +0.2 (standardised to 900-1800yr period) temperature anomaly during the period 0 to AD1950, which increases further to +1.4 for the very latest records. The recent warming trend agrees with the global climate review articles shown below by Mann et al (2008) and Moberg et al (2005). The global reconstructions, however, show greater variability during the '1900 year cooling period', suggesting that the cooling trend appears to be confined to the Arctic caused by the dominance of solar forcing upon the regional climate.


(F) decreasing solar insolation recieved at the atmosphere in the arctic region caused by precession (G) synthesised reconstruction from this study shown in grey compared to global synthesis reconstructions.

In light of the past 2Kyr then, the recent warming trend in the Arcticis sudden at around 1950, and reverses the cooling trend of the past 2Kyr despite continued precessional forcing. It is clear from this study that the recent warming is unusual and has been clearly registered on a number of proxy records around the arctic. The extent of this synthesis is only 2Kyr, however. In the next post I'll look at a few papers to get an idea of the Arctic climate throughout the Holocene.


Sunday 23 October 2011

Frozen Planet, but for how much longer?

Just came across this new series narrated by David Attenborough called 'Frozen Planet'. As the title suggests it is about the polar regions, and includes a final episode called 'on thin ice' written by Attenborough discussing the recent changes to them and the implications for all of us.

Here's the BBC advert, featuring some very dramatic music...


The series starts on Wednesday, but until then you can watch a few clips here.

Where’s the evidence?


A key question to ask before discussing potential impacts of human activity upon Arctic ecosystems is:

How do we know that the recent warming trend in the Arctic is unusual when compared to long-term natural cycles?

As instrumental records are limited both in spatial and temporal extent (earliest records go back only a couple of centuries) they are not adequate to answer this question. The answer comes in the form of palaeo-records; naturally stored records of past environmental conditions. Before I plunge into reviewing scientific papers, I thought it would be a good idea to review some key concepts which we can refer back to later in the blog. As we'll see, the answer to 'where's the evidence?' is: everywhere!

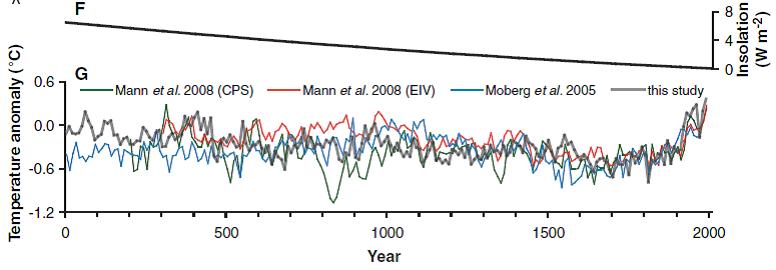
I’ve heard about ice cores and seen the hockey stick diagram, is this what you’re talking about?

In part, yes! Ice cores contain a number of proxies (indicators) of past conditions around the Arctic, and contribute to understanding of global interactions. Most key ice-core records from the Arctic are from Greenland including GISP/Grip and NGRIP. A common proxy used from ice-cores is the δ18O:δ16O ratio, a comparison between two stable forms of oxygen isotope found bonded with hydrogen in the water molecules (H2O, I’m trying not to insult your intelligence!).

As δ18O is two protons heavier than δ16O, it requires more energy to evaporate and condensates more readily. Therefore, by measuring this ratio in ice cores, it is possible to reconstruct past temperatures as well as a history of moisture transport. Cold temperatures generally are indicated by a lower concentration of the heavier isotope δ18O. Oxygen isotope records are also found in other proxies including in tree-rings and in the chemical composition of marine organism shells. Other proxies included in ice cores are deuterium ratios (heavy hydrogen), greenhouse gas concentrations (care is required due to a certain amount of gas exchange) as well as many others.

So, that’s it?

Fortunately (or I suppose unfortunately depending on your viewpoint) not, there’s a couple more key records used to reconstruct Arctic environments which will crop up a lot in this blog, proxies found in lake sediments and marine records as well as tree rings.

How can lake sediments show past environment?

Common to most palaeo-records is a build-up of material over time, as happens with lake sediments. All manner of organisms and materials build up with this sediment, and these themselves are the proxies. A common proxy is diatom frustules, siliceous shells of microscopic algae of which there are thousands of species. These all respond to different conditions favourably, so by recording the species community composition, it is possible to reconstruct the past conditions qualitatively (descriptively) or quantitatively (through the use of transfer functions). Diatoms can be identified relatively easily under a light microscope, if you know what you’re doing that is (as a side point, if you don’t, as I’ve experienced, the number of species can be quite overwhelming).

Other proxies include chironomidae (non-biting midge species), fossil pollen and marine ostracod records (bivalve crustaceans). Also, a recently developed but useful record is SCP (spheroidal carbonaceous particles) which are produced from burning. They indicate atmospheric contamination when found in lake sediments.

From these records and knowledge of the conditions individual species prefer today, it is possible to reconstruct many aspects of the environment including temperatures, pH, Total Phosporous (TP) and ice cover as well as many others.

What about tree rings?

Everyone knows you can count tree rings to find the age of a tree, as they build up in layers over time. Due to this quality of a ring layer growing during one year, tree-ring proxies have the useful feature of being annually resolved; having an environmental record for each individual year. The longest complete records extend past 10,000 years before 1950 (10Kyr BP) include fossilised tree remains, giving an almost complete record of the Holocene (they also allow the calibration of radiocarbon dates to calendar years as described here). Analysis of tree rings is called ‘dendrochronology’.

Fossilised tree records contain much information, including the dating of extreme events as well as climate records. Trees destroyed due to an earthquake, for example, can show the exact date of that event if patterns are widespread. Climatic information is revealed by the widths of tree rings themselves; narrow rings indicate drought or cold years. If these patterns are seen across a wide area, a regional climatic pattern may be inferred to a very high resolution.

Thanks! You’ve made everything absolutely clear and I have no further questions.

Great! (If, as is more likely, you have any issues with this post, please comment).

It's important to make the point at this stage that reconstructions from palaeo-records are not perfect and do not always agree. Natural systems are complicated and are not always fully understood, and the patterns observable today may not have always worked in the same way throughout all glacial-interglacial cycles. Therefore, assumptions are stretched for very old reconstructions. Multi-proxy studies are desirable and when possible will be preferentially referred to in this blog.

The next post will consider some key papers which have used these proxies, focussing on this article.
______

For a much better and thorough summary of all of these proxies see the book ‘Global Change in the Holocene’ by Mackay et al eds. (2005) published by Hodder Arnold 528pp. 

Monday 17 October 2011

Out of sight, out of mind?

Last month (Sept 2011) marked the end of the summer maximum in the northern hemisphere, and the total sea ice extent change data is beginning to emerge. This year’s summer extent was on a par with the record low of 2007 (since satellite records began in 1979) despite weather conditions being less favourable to sea ice loss than in that year. The National Snow and Ice Data Centre (NSIDC) remote sensing records on sea ice extent for the past few years are shown below:


It is clear from this that recent summer, and to a lesser extent, winter ice extent is far below the average of the past 30 years plus two standard deviations. It could be said then, that the ‘climate’ of sea ice in the region is changing.

Overall, the far north is changing faster than almost anywhere else on earth. For this reason, it is likely that the arctic region is going to give the best warning signs as to the rate and severity of global climatic change. I will try in this blog over the coming months to engage with (and hopefully come to some conclusions about) important questions surrounding the change in the arctic regions, namely:

How do we know the sea ice retreat registered by satellite data in the past c.30 years is unusual?
Are any changes apparent in terrestrial and aquatic arctic ecosystems?
Is anything else apart from rising temperatures causing change?
What is the likely impact of future human activity on marine and terrestrial arctic ecosystems?
Will changes in the Arctic have an effect on the global climate? 
What has this got to do with me? Should I be worried?

Even if you have no interest in the environment (but if you’re reading this I’d expect, and indeed hope that you are) the changes facing the arctic regions are likely to have severe economic, cultural and (geo)political impacts. Although a ‘cold’ war is unlikely (despite scare stories in the media), human activities such as patterns of transport and resource use are likely to be affected. Indeed, geopolitical wrangling has been going on for some time (eg Russian flag planting mission).

The aim of this blog is not to discuss solutions to rising CO2 emissions and climate change, but rather to see how arctic ecosystems have been and continue to be changed by climate changes and occasionally give examples of how this is likely to affect human activities. This will be done by discussing studies on past change, current measurements and future predictions.

Please feel free to disagree, argue with or debate anything I’ve written (as long as they’re at least mildly constructive!) by commenting.